Statistical Process Control (SPC) Explained: Signal or Noise?
An operator nudges the tool after each shaft that comes out big or small, and the shafts get worse. How to tell a real change in a process from its day-to-day wobble: common and special cause, the X bar and R chart, why control limits are not tolerances, how to read the signals, which chart fits which data, and why chasing a size widens the spread.
Problem
An operator measures each shaft that comes off the machine. If it is a little big, the tool gets nudged in; a little small, and it is nudged back. It is careful work, and it makes the shafts worse. The opposite mistake costs just as much: a tool slowly wears down, the sizes creep up inside the day-to-day wobble, and nobody notices until a crate of shafts goes in the scrap bin. Both come from the same gap, not knowing a real change in a process from its ordinary variation.
Quick Answer
The short version
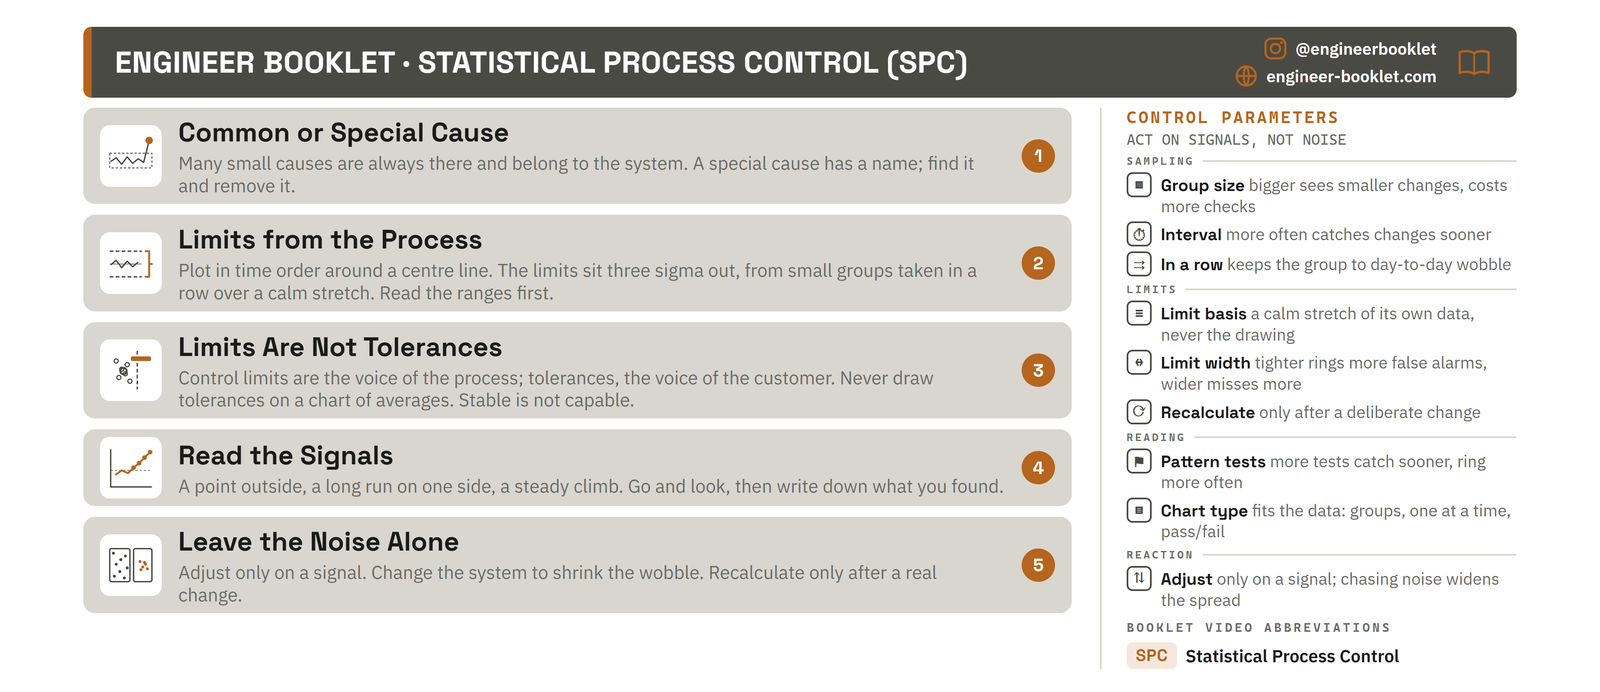
A control chart plots the measurements a process makes, in the order it makes them. A centre line marks the average, and two control limits sit either side at three times the natural spread, worked out from the process’s own data. Points that wobble between the limits with no pattern come from common cause, many small causes that are always there. A point outside the limits, or a long run on one side of the centre line, comes from a special cause, one thing that changed and has a name. A signal means go and find the cause; no signal means leave the machine alone. And the limits come from the process, never from the drawing: mix them up with the tolerance, and a chart can hide a bad part.
Deep Dive
Every process wobbles. The skill is telling that wobble from a real change, because the two need opposite reactions: a real change gets found and removed, and the wobble gets left alone. The map: